File:Global Warming Observed CO2 Emissions from fossil fuel burning vs IPCC scenarios.svg

Original file (SVG file, nominally 660 × 470 pixels, file size: 23 KB)
| This is a file from the Wikimedia Commons. The description on its description page there is shown below.
|
Summary
| Description |
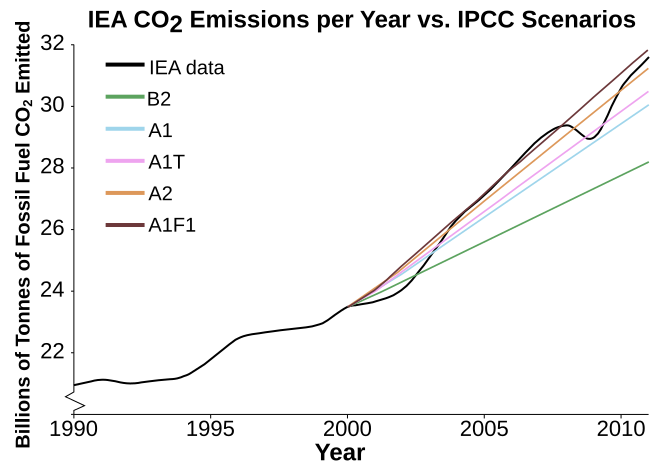
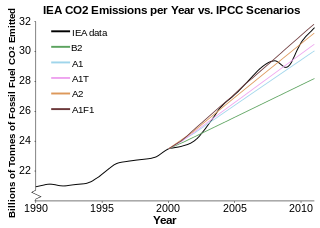
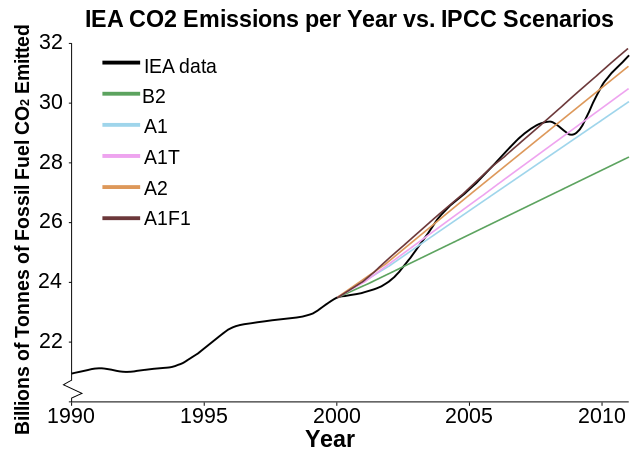
English: Shows in graphic form the projected increase in carbon dioxide (CO2) emissions from fossil fuels in five of the emissions scenarios used by the Intergovernmental Panel on Climate Change (IPCC), compared to the International Energy Agency's (IEA's) actual observational CO2 emissions data from fossil fuel consumption.
The graph shows five of the illustrative "marker" scenarios from the IPCC's Special Report on Emissions Scenarios (SRES). The SRES report contains a total of 40 greenhouse gas emissions scenarios. Between the years 2000-2009, growth in CO2 emissions from fossil fuel burning was, on average, 3% per year, which exceeds the growth estimated by 35 of the 40 SRES scenarios (34 if the trend is computed with end points instead of a linear fit) (Le Quéré et al., 2010). Data sources: Data from IPCC emissions scenarios at google.com/url?sa=t&source=web&cd=4&ved=0CC4QFjAD&url=http%3A%2F%2Fwww.ipcc.ch%2Fipccreports%2Fsres%2Femission%2Fdata%2Fallscen.xls&rct=j&q=ipcc%20sres%20CO2%20emissions%20excel&ei=3driTeSRIYjXiAKUupC8Bg&usg=AFQjCNH0tbCc6eAG-9hIYHsIrCmk88UEvg&sig2=phb20XH_kZxuQ_AlT8wIbA&cad=rja%20 ; Data spreadsheet included with International Energy Agency's "CO2 Emissions from Fuel Combustion 2011 - Highlights"; and Supplemental 2010 IEA data; and Supplemental 2011 IEA data References:
|
| Date | |
| Source | Based on File:Global Warming Observed CO2 Emissions from fossil fuel burning vs IPCC scenarios.jpg, originally from http://www.skepticalscience.com/graphics.php |
| Author | Dana Nuccitelli, vectorized by User:Dcoetzee |
| Other versions |
|
Licensing
- You are free:
- to share – to copy, distribute and transmit the work
- to remix – to adapt the work
- Under the following conditions:
- attribution – You must give appropriate credit, provide a link to the license, and indicate if changes were made. You may do so in any reasonable manner, but not in any way that suggests the licensor endorses you or your use.
- share alike – If you remix, transform, or build upon the material, you must distribute your contributions under the same or compatible license as the original.

|
This SVG file contains embedded text that can be translated into your language, using any capable SVG editor, text editor or the SVG Translate tool. For more information see: About translating SVG files. |
File history
Click on a date/time to view the file as it appeared at that time.
| Date/Time | Dimensions | User | Comment | |
|---|---|---|---|---|
| current | 23:45, 19 June 2013 | 660 × 470 (23 KB) | Dcoetzee | Break y axis to indicate it doesn't start at 0 |
File usage
The following page uses this file: