File:UK EU referendum polling.svg

Original file(SVG file, nominally 900 × 630 pixels, file size: 329 KB)

Commons-logo.svg This is a file from the Wikimedia Commons. The description on its description page there is shown below.
Commons is a freely licensed media file repository. You can help.

Summary

Description
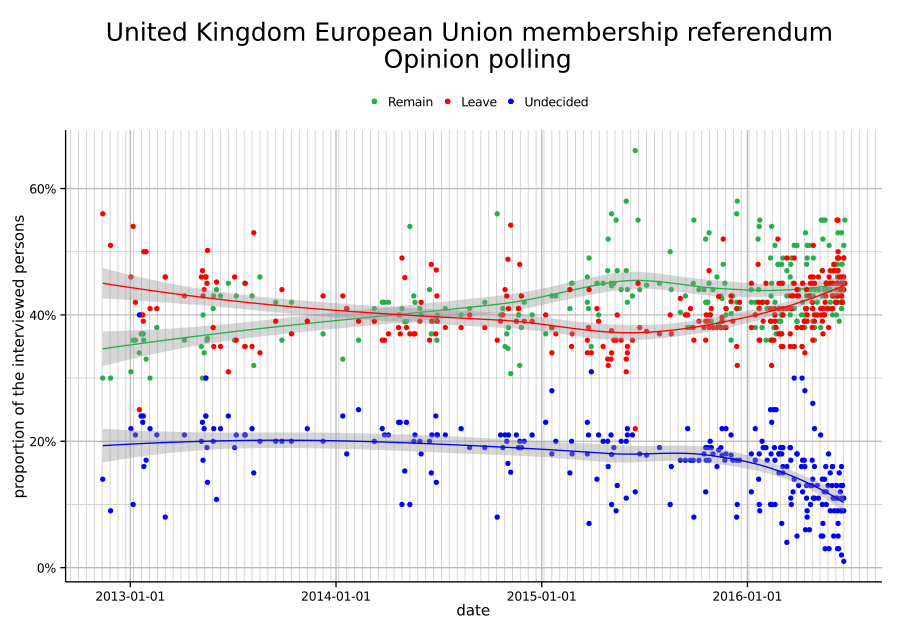
Deutsch: Entwicklung der Befragungsergebnisse für das Referendum über den Verbleib des Vereinigten Königreiches in der Europäischen Union
 
bleiben
 
verlassen
 
unentschieden
English: Opinion polling on the United Kingdom European Union membership referendum
 
remain
 
leave
 
undecided
Français : Sondages d'opinion sur le référendum autour du maintien/sortie du R.U. dans l'U.E.
 
Rester
 
Quitter
 
NSP encore
Italiano: Sondaggio di opinione sul referendum per la permanenza del Regno Unito nell'Unione Europea
 
Rimanere
 
Abbandonare
 
Indecisi
Македонски: Исход од испитувањето на јавното мислење на референдумот за членството на Велика Бротанија во ЕУ.
 
останување
 
напуштање
 
нерешени
Polski: Sondaże w sprawie referendum w Wielkiej Brytanii o członkostwie w Unii Europejskiej
 
zostać
 
wyjść
 
nie ma zdania
Español: Sondaje de opinión respecto al Referéndum sobre la permanencia del Reino Unido en la Unión Europea
 
continuar en la UE
 
dejar la UE
 
indecisos
Date
Source Own work
Author T.seppelt
SVG development
InfoField
 
The SVG code is valid.
 
This chart was created with R.
Source code
InfoField
R code
The data can be edited at [[User:T.seppelt/UK EU referendum polling.csv]]. [[:User:T.seppelt|T.seppelt]] is going to refresh the diagram after updating this page. The diagram was generated with this script:

require(ggplot2)
library(scales)

download.file("https://commons.wikimedia.org/w/index.php?title=User:T.seppelt/UK_EU_referendum_polling.csv&action=raw", destfile = "/tmp/test.csv",method="curl")

data <- read.csv("/tmp/test.csv", dec=".", sep="," ,colClasses=c("Date","numeric","numeric","numeric","numeric",NA, NA));

data$remain <- data$remain / 100
data$leave <- data$leave / 100
data$undecided <- data$undecided / 100

df1 <- data.frame(date = data$date, remain = data$remain,leave = data$leave,undecided = data$undecided);

green <- "#24B14C"

svg("UK EU referendum polling.svg", width = 10, height = 7, family="sans-serif", bg="transparent")
g <- ggplot(df1,aes(x=date));
g <- g + scale_x_date(labels = date_format("%Y-%m-%d"), minor_breaks="2 week");
g <- g + labs(title = "United Kingdom European Union membership referendum \n Opinion polling")
g <- g + xlab("date");
g <- g + ylab("proportion of the interviewed persons")
g <- g + geom_point(data=df1,aes(x=date,y=remain,colour="Remain"));
g <- g + geom_smooth(data=df1,aes(x=date,y=remain), colour=green)
g <- g + geom_point(data=df1,aes(x=date,y=leave,colour="Leave"));
g <- g + geom_smooth(data=df1,aes(x=date,y=leave), colour="red")
g <- g + geom_point(data=df1,aes(x=date,y=undecided,colour="Undecided"));
g <- g + geom_smooth(data=df1,aes(x=date,y=undecided), colour="blue")
#g <- g + geom_line(aes(y=50),color="black")
g <- g +  scale_colour_manual("", 
                              breaks = c("Remain", "Leave", "Undecided"),
                              values = c("red", green, "blue"))
g <- g + scale_y_continuous(labels=percent)
g <- g + theme_classic() + theme(
  rect = element_rect(fill = "transparent",colour = NA),
  panel.grid.major = element_line(colour = "#bbbbbb", size = 0.5),
  panel.grid.minor = element_line(colour = "#cccccc", size = 0.3),
  panel.background  = element_rect(fill = "transparent",colour = NA),
  legend.key = element_rect(fill = "transparent",colour = NA)
) + theme(legend.position="top")+theme(plot.title=element_text(size=20));
g
dev.off();
g
R code (2)
I had to make some slight adjustments to the script to get it to work with R 3.2.3 and ggplot2 2.0.0. – [[:User:Kanoch|Kanoch]] 

require(ggplot2)
library(scales)

download.file("https://commons.wikimedia.org/w/index.php?title=User:T.seppelt/UK_EU_referendum_polling.csv&action=raw", destfile = "/tmp/test.csv",method="curl")

data <- read.csv("/tmp/test.csv", dec=".", sep="," ,colClasses=c("Date",NA,NA,NA,NA,NA,NA));

data$remain <- data$remain / 100
data$leave <- data$leave / 100
data$undecided <- data$undecided / 100

svg("UK EU referendum polling.svg", width = 10, height = 7, family="sans-serif", bg="transparent")
df1 <- data.frame(date = data$date, remain = data$remain,leave = data$leave,undecided = data$undecided);
g <- ggplot(df1,aes(x=date,df1));
g <- g + scale_x_date(date_labels="%Y-%m-%d", date_minor_breaks="2 week");
g <- g + labs(title = "United Kingdom European Union membership referendum \n Opinion polling")
g <- g + xlab("date");
g <- g + ylab("proportion of the interviewed persons")
g <- g + geom_point(data=df1,aes(x=date,y=remain,colour="Remain"));
g <- g + geom_smooth(data=df1,aes(x=date,y=remain), colour="green")
g <- g + geom_point(data=df1,aes(x=date,y=leave,colour="Leave"));
g <- g + geom_smooth(data=df1,aes(x=date,y=leave), colour="red")
g <- g + geom_point(data=df1,aes(x=date,y=undecided,colour="Undecided"));
g <- g + geom_smooth(data=df1,aes(x=date,y=undecided), colour="blue")
g <- g +  scale_colour_manual("", 
                              breaks = c("Remain", "Leave", "Undecided"),
                              values = c("red", "green", "blue"))
g <- g + theme(legend.position="top")+theme(plot.title=element_text(size=20));
g <- g + scale_y_continuous(labels=percent)
g
dev.off();

Licensing

I, the copyright holder of this work, hereby publish it under the following license:
w:en:Creative Commons
attribution share alike
This file is licensed under the Creative Commons Attribution-Share Alike 4.0 International license.
You are free:
  • to share – to copy, distribute and transmit the work
  • to remix – to adapt the work
Under the following conditions:
  • attribution – You must give appropriate credit, provide a link to the license, and indicate if changes were made. You may do so in any reasonable manner, but not in any way that suggests the licensor endorses you or your use.
  • share alike – If you remix, transform, or build upon the material, you must distribute your contributions under the same or compatible license as the original.

Captions

Add a one-line explanation of what this file represents

Items portrayed in this file

depicts

29 October 2015

File history

Click on a date/time to view the file as it appeared at that time.

Date/TimeDimensionsUserComment
current03:49, 24 June 2016900 × 630 (329 KB)T.seppeltfinal update to 277 polls

Metadata