File:Web browser usage share StatCounter.svg

Size of this PNG preview of this SVG file: 800 × 571 pixels. Other resolutions: 320 × 229 pixels | 640 × 457 pixels | 1,024 × 731 pixels | 1,280 × 914 pixels | 1,260 × 900 pixels.
Original file (SVG file, nominally 1,260 × 900 pixels, file size: 66 KB)
| This is a file from the Wikimedia Commons. The description on its description page there is shown below.
|
Summary
| Description |
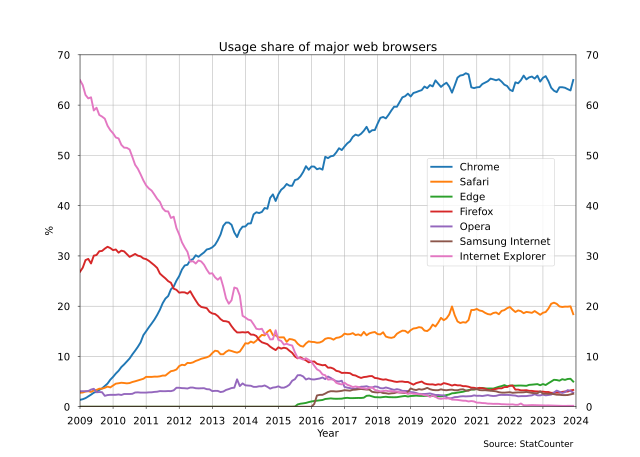
English: Development of web browser usage share according to StatCounter data. Only browsers with a share of 2% or higher in December 2023 or ones with a share of more than 10% in the past are plotted. This file was derived from: Web browser usage share, May 2017.svg |
||
| Date | |||
| Source | Own work | ||
| Author | Geek3 | ||
| SVG development | This plot was created with Matplotlib. | ||
| Source code | Python code
|

|
This file may be updated to reflect new information. If you wish to use a specific version of the file without new updates being mirrored, please upload the required version as a separate file. |
Licensing
I, the copyright holder of this work, hereby publish it under the following license:
This file is licensed under the Creative Commons Attribution-Share Alike 3.0 Unported license.
- You are free:
- to share – to copy, distribute and transmit the work
- to remix – to adapt the work
- Under the following conditions:
- attribution – You must give appropriate credit, provide a link to the license, and indicate if changes were made. You may do so in any reasonable manner, but not in any way that suggests the licensor endorses you or your use.
- share alike – If you remix, transform, or build upon the material, you must distribute your contributions under the same or compatible license as the original.
File history
Click on a date/time to view the file as it appeared at that time.
| Date/Time | Dimensions | User | Comment | |
|---|---|---|---|---|
| current | 15:24, 12 December 2023 | 1,260 × 900 (66 KB) | Morn | simplify the label for Edge again |
File usage
The following page uses this file: